Diving behaviour analysis#
Here is a bird’s-eye view of the functionality of scikit-diveMove, loosely following diveMove’s vignette.
Set up the environment. Consider loading the logging module and
setting up a logger to monitor progress to this section.
1# Set up
2import importlib.resources as rsrc
3import matplotlib.pyplot as plt
4import skdiveMove as skdive
5
6# Declare figure sizes
7_FIG1X1 = (11, 5)
8_FIG2X1 = (10, 8)
9_FIG3X1 = (11, 11)
Reading data files#
Load diveMove’s example data, using TDR.__init__() method, and
print:
18ifile = (rsrc.files("skdiveMove") / "tests" / "data" /
19         "ag_mk7_2002_022.nc")
20tdrX = skdive.TDR.read_netcdf(ifile, depth_name="depth",
21                              time_name="date_time", has_speed=True)
22# Or simply use function ``skdive.tests.diveMove2skd`` to do the
23# same with this particular data set.
24print(tdrX)
Time-Depth Recorder -- Class TDR object
Source File          /opt/hostedtoolcache/Python/3.12.6/x64/lib/python3.12/site-packages/skdiveMove/tests/data/ag_mk7_2002_022.nc
Sampling interval    0 days 00:00:05
Number of Samples    34199
Sampling Begins      2002-01-05 11:32:00
Sampling Ends        2002-01-07 11:01:50
Total duration       1 days 23:29:50
Measured depth range [-4.0,91.0]
Other variables      ['light', 'temperature', 'speed']
Attributes:
                          animal_id: Ag_022
              animal_species_common: Antarctic fur seal
             animal_species_science: Arctocephalus gazella
                 data_creation_date: 2020-07-13 17:00:00
                        data_format: CSV
                        data_nfiles: 1
                        data_source: dives.csv
       dep_device_regional_settings: YYYY-mm-dd HH:MM:SS
                   dep_device_tzone: +5
                             dep_id: ag_mk7_2002_022
              deploy_device_time_on: 2002-01-05 11:32:00
                         deploy_lat: 51.9833294
                    deploy_locality: Iles Crozet, Southern Indian Ocean
                         deploy_lon: -46.416665
                      deploy_method: glued
                        device_make: Wildlife Computers
                       device_model: MK7
                        device_type: archival
                   project_date_beg: 2000-11-01
                   project_date_end: 2003-04-30
                       project_name: Antarctic and Subantarctic fur seal foraging/energetics
               provider_affiliation: Centre d'Etudes Biologiques de Chize, France
                     provider_email: spluque@gmail.com
                   provider_license: AGPLv3
                      provider_name: Sebastian Luque
                       sensors_list: pressure,light,temperature,speed
ZOC method:          None
ZOC parameters:      None
Wet/Dry parameters:  {}
Dives parameters:    {}
Speed calibration coefficients: (a=None, b=None)
Notice that TDR.__init__() reads files in NetCDF4 format, which is
a very versatile file format, and encourages using properly documented data
sets. skdiveMove relies on xarray.Dataset objects to represent
such data sets. It is easy to generate a xarray.Dataset objects
from Pandas DataFrames by using method
to_xarray(). skdiveMove documents processing
steps by appending to the history attribute, in an effort towards
building metadata standards.
Access measured data:
25tdrX.get_depth("measured")
<xarray.DataArray 'depth' (date_time: 34199)> Size: 274kB
array([+nan, +nan, +nan, ..., +nan, +nan, +nan])
Coordinates:
  * date_time  (date_time) datetime64[ns] 274kB 2002-01-05T11:32:00 ... 2002-...
Attributes:
    sampling:             regular
    sampling_rate:        5
    sampling_rate_units:  s
    name:                 P
    full_name:            Depth
    description:          dive depth
    units:                m H2O
    units_name:           meters H2O (salt)
    units_label:          meters
    column_name:          depth
    axes:                 D
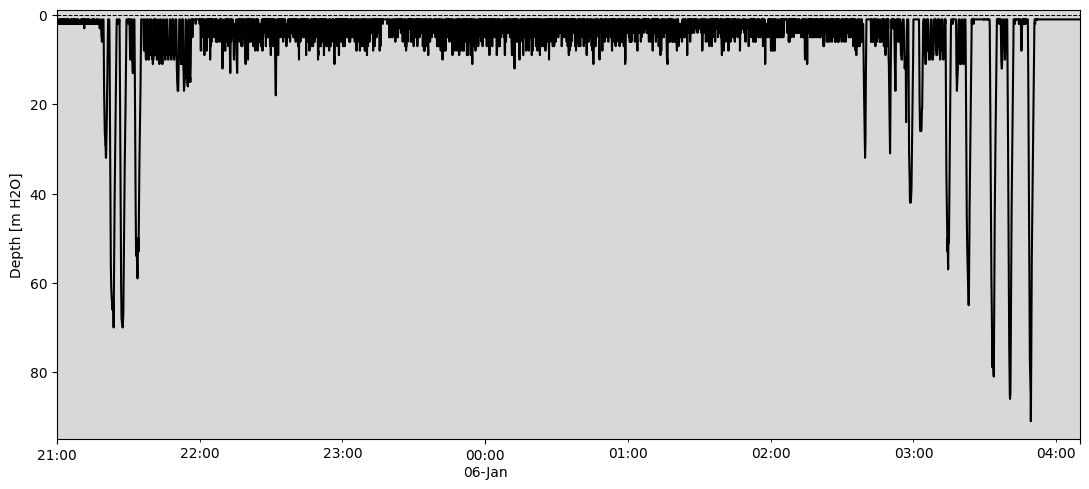
files: dives.csvPlot measured data:
26tdrX.plot(xlim=["2002-01-05 21:00:00", "2002-01-06 04:10:00"],
27          depth_lim=[-1, 95], figsize=_FIG1X1);
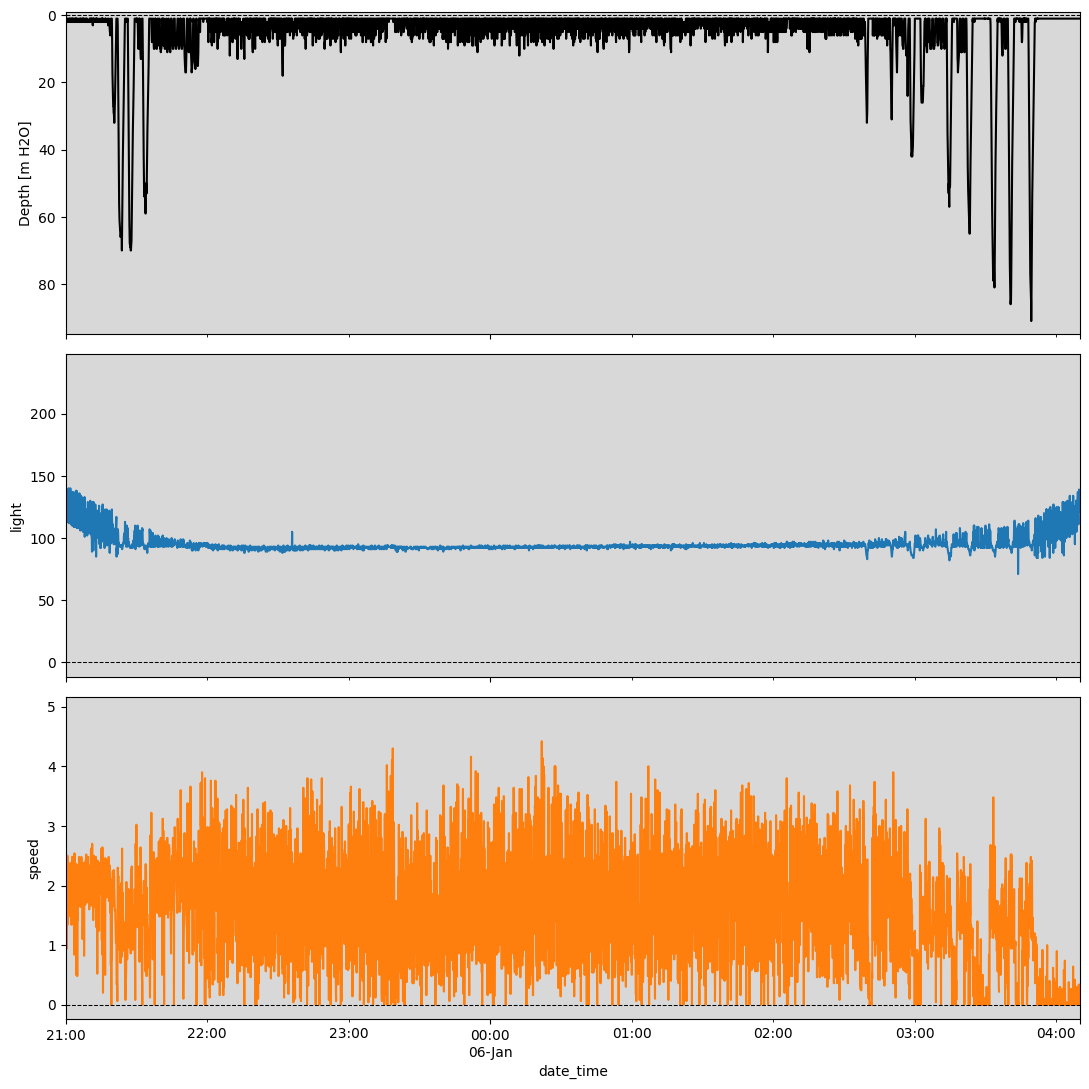
Plot concurrent data:
28ccvars = ["light", "speed"]
29tdrX.plot(xlim=["2002-01-05 21:00:00", "2002-01-06 04:10:00"],
30          depth_lim=[-1, 95], concur_vars=ccvars, figsize=_FIG3X1);
Calibrate measurements#
Calibration of TDR measurements involves the following steps, which rely on data from pressure sensors (barometers):
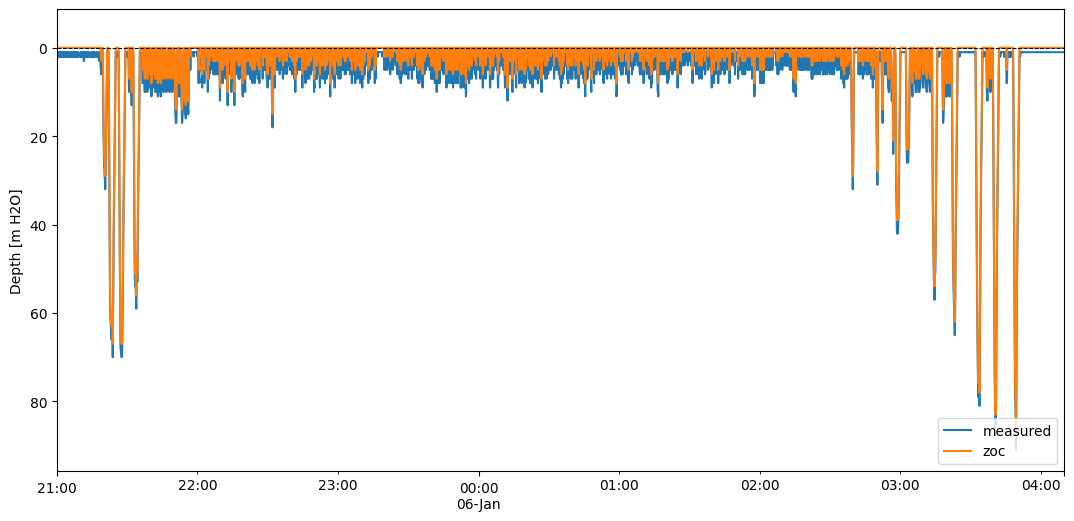
Zero offset correction (ZOC) of depth measurements#
Using the offset method here for speed performance reasons:
31# Helper dict to set parameter values
32pars = {"offset_zoc": 3,
33        "dry_thr": 70,
34        "wet_thr": 3610,
35        "dive_thr": 3,
36        "dive_model": "unimodal",
37        "knot_factor": 3,
38        "descent_crit_q": 0,
39        "ascent_crit_q": 0}
40
41tdrX.zoc("offset", offset=pars["offset_zoc"])
42
43# Plot ZOC job
44tdrX.plot_zoc(xlim=["2002-01-05 21:00:00", "2002-01-06 04:10:00"],
45              figsize=(13, 6));
Detection of wet vs dry phases#
Periods of missing depth measurements longer than dry_thr are considered dry phases, whereas periods that are briefer than wet_thr are not considered to represent a transition to a wet phase.
46tdrX.detect_wet(dry_thr=pars["dry_thr"], wet_thr=pars["wet_thr"])
Other options, not explored here, include providing a boolean mask Series to indicate which periods to consider wet phases (argument wet_cond), and whether to linearly interpolate depth through wet phases with duration below wet_thr (argument interp_wet).
Detection of dive events#
When depth measurements are greater than dive_thr, a dive event is deemed to have started, ending when measurements cross that threshold again.
47tdrX.detect_dives(dive_thr=pars["dive_thr"])
Detection of dive phases#
Two methods for dive phase detection are available (unimodal and smooth.spline), and this demo uses the default unimodal method:
48tdrX.detect_dive_phases(dive_model=pars["dive_model"],
49                        knot_factor=pars["knot_factor"],
50                        descent_crit_q=pars["descent_crit_q"],
51                        ascent_crit_q=pars["ascent_crit_q"])
52
53print(tdrX)
Time-Depth Recorder -- Class TDR object
Source File          /opt/hostedtoolcache/Python/3.12.6/x64/lib/python3.12/site-packages/skdiveMove/tests/data/ag_mk7_2002_022.nc
Sampling interval    0 days 00:00:05
Number of Samples    34199
Sampling Begins      2002-01-05 11:32:00
Sampling Ends        2002-01-07 11:01:50
Total duration       1 days 23:29:50
Measured depth range [-4.0,91.0]
Other variables      ['light', 'temperature', 'speed']
Attributes:
                          animal_id: Ag_022
              animal_species_common: Antarctic fur seal
             animal_species_science: Arctocephalus gazella
                 data_creation_date: 2020-07-13 17:00:00
                        data_format: CSV
                        data_nfiles: 1
                        data_source: dives.csv
       dep_device_regional_settings: YYYY-mm-dd HH:MM:SS
                   dep_device_tzone: +5
                             dep_id: ag_mk7_2002_022
              deploy_device_time_on: 2002-01-05 11:32:00
                         deploy_lat: 51.9833294
                    deploy_locality: Iles Crozet, Southern Indian Ocean
                         deploy_lon: -46.416665
                      deploy_method: glued
                        device_make: Wildlife Computers
                       device_model: MK7
                        device_type: archival
                   project_date_beg: 2000-11-01
                   project_date_end: 2003-04-30
                       project_name: Antarctic and Subantarctic fur seal foraging/energetics
               provider_affiliation: Centre d'Etudes Biologiques de Chize, France
                     provider_email: spluque@gmail.com
                   provider_license: AGPLv3
                      provider_name: Sebastian Luque
                       sensors_list: pressure,light,temperature,speed
ZOC method:          offset
ZOC parameters:      {'offset': 3}
Wet/Dry parameters:  {'dry_thr': 70, 'wet_thr': 3610}
Dives parameters:    {'dive_thr': 3, 'dive_model': 'unimodal', 'smooth_par': 0.1, 'knot_factor': 3, 'descent_crit_q': 0, 'ascent_crit_q': 0}
Speed calibration coefficients: (a=None, b=None)
Alternatively, all these steps can be performed together via the
calibrate() function:
54help(skdive.calibrate)
Help on function calibrate in module skdiveMove.tdr:

calibrate(tdr_file, config_file=None)
    Perform all major TDR calibration operations

    Detect periods of major activities in a `TDR` object, calibrate depth
    readings, and speed if appropriate, in preparation for subsequent
    summaries of diving behaviour.

    This function is a convenience wrapper around :meth:`~TDR.detect_wet`,
    :meth:`~TDR.detect_dives`, :meth:`~TDR.detect_dive_phases`,
    :meth:`~TDR.zoc`, and :meth:`~TDR.calibrate_speed`.  It performs
    wet/dry phase detection, zero-offset correction of depth, detection of
    dives, as well as proper labelling of the latter, and calibrates speed
    data if appropriate.

    Due to the complexity of this procedure, and the number of settings
    required for it, a calibration configuration file (JSON) is used to
    guide the operations.

    Parameters
    ----------
    tdr_file : str, Path or xarray.backends.*DataStore
        As first argument for :func:`xarray.load_dataset`.
    config_file : str
        A valid string path for TDR calibration configuration file.

    Returns
    -------
    out : TDR

    See Also
    --------
    dump_config_template : configuration template
which is demonstrated in Bout analysis.
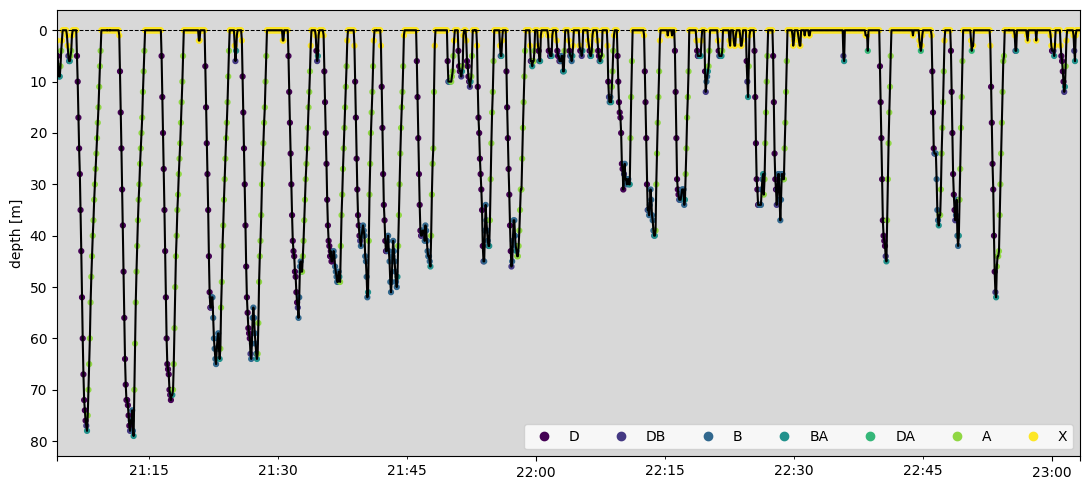
Plot dive phases#
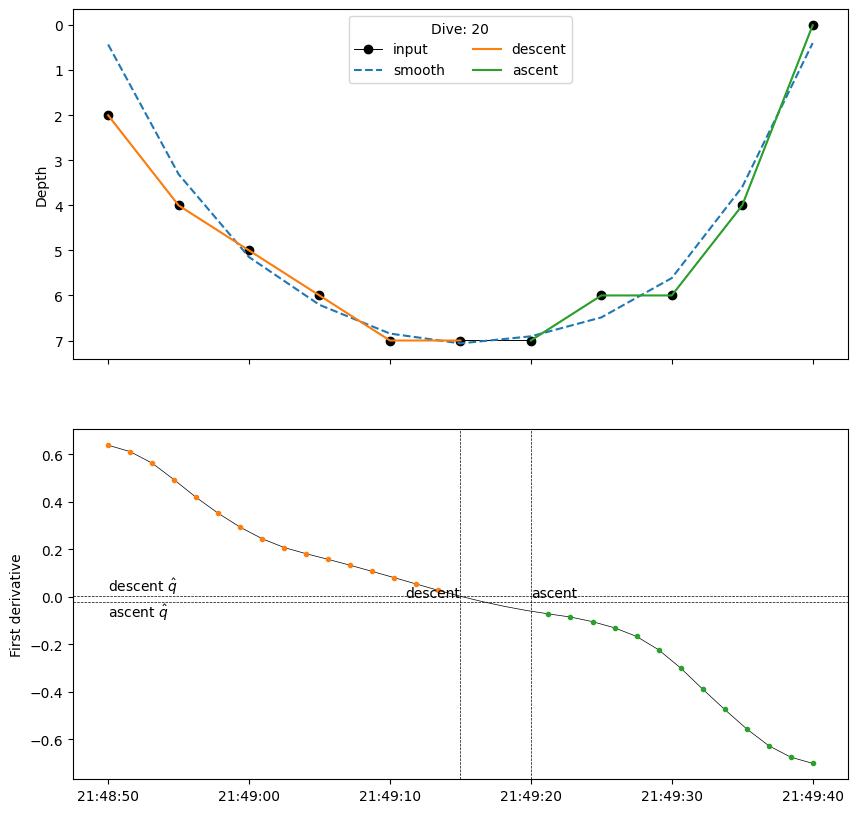
Once TDR data are properly calibrated and phases detected, results can be visualized:
55tdrX.plot_phases(diveNo=list(range(250, 300)), surface=True, figsize=_FIG1X1);
56# Plot dive model for a dive
57tdrX.plot_dive_model(diveNo=20, figsize=(10, 10));
Calibrate speed measurements#
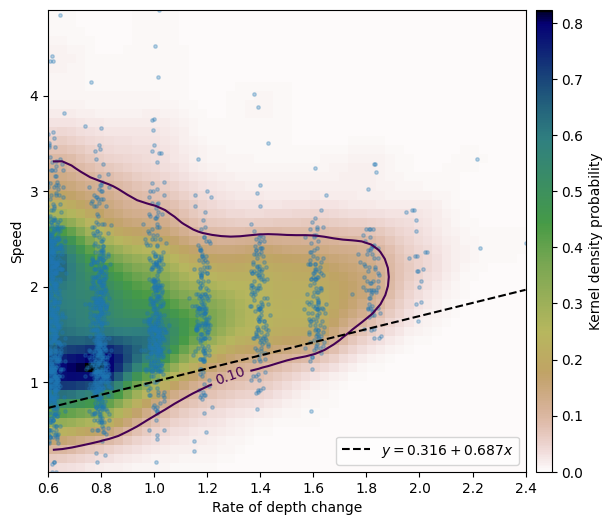
In addition to the calibration procedure described above, other variables in the data set may also need to be calibrated. skdiveMove provides support for calibrating speed sensor data, by taking advantage of its relationship with the rate of change in depth in the vertical dimension.
58fig, ax = plt.subplots(figsize=(7, 6))
59# Consider only changes in depth larger than 2 m
60tdrX.calibrate_speed(z=2, ax=ax)
61print(tdrX.speed_calib_fit.summary())
                         QuantReg Regression Results
==============================================================================
Dep. Variable:                      y   Pseudo R-squared:              0.07433
Model:                       QuantReg   Bandwidth:                      0.2129
Method:                 Least Squares   Sparsity:                        2.682
Date:                Tue, 15 Oct 2024   No. Observations:                 2108
Time:                        02:58:09   Df Residuals:                     2106
                                        Df Model:                            1
==============================================================================
                 coef    std err          t      P>|t|      [0.025      0.975]
------------------------------------------------------------------------------
Intercept      0.3163      0.049      6.405      0.000       0.219       0.413
x              0.6872      0.049     13.902      0.000       0.590       0.784
==============================================================================
Notice processing steps have been appended to the history attribute of
the xarray.DataArray:
62print(tdrX.get_depth("zoc"))
<xarray.DataArray 'depth' (date_time: 34199)> Size: 274kB
array([+nan, +nan, +nan, ..., +nan, +nan, +nan])
Coordinates:
  * date_time  (date_time) datetime64[ns] 274kB 2002-01-05T11:32:00 ... 2002-...
Attributes: (12/13)
    sampling:             regular
    sampling_rate:        5
    sampling_rate_units:  s
    name:                 P
    full_name:            Depth
    description:          dive depth
    ...                   ...
    units_name:           meters H2O (salt)
    units_label:          meters
    column_name:          depth
    axes:                 D
    files:                dives.csv
    history:              ZOC
63print(tdrX.get_speed("calibrated"))
<xarray.DataArray 'speed' (date_time: 34199)> Size: 274kB
array([+nan, +nan, +nan, ..., +nan, +nan, +nan])
Coordinates:
  * date_time  (date_time) datetime64[ns] 274kB 2002-01-05T11:32:00 ... 2002-...
Attributes: (12/13)
    sampling:             regular
    sampling_rate:        5
    sampling_rate_units:  s
    name:                 S
    full_name:            Speed
    description:          speed with respect to medium
    ...                   ...
    units_name:           meters per second
    units_label:          meters m/s
    column_name:          speed
    axes:                 F
    files:                dives.csv
    history:              speed_calib_fit
Access attributes of TDR instance#
Following calibration, use the different accessor methods:
64# Time series of the wet/dry phases
65print(tdrX.wet_dry)
                     phase_id phase_label
date_time
2002-01-05 11:32:00         1           L
2002-01-05 11:32:05         1           L
2002-01-05 11:32:10         1           L
2002-01-05 11:32:15         1           L
2002-01-05 11:32:20         1           L
...                       ...         ...
2002-01-07 11:01:30         7           L
2002-01-07 11:01:35         7           L
2002-01-07 11:01:40         7           L
2002-01-07 11:01:45         7           L
2002-01-07 11:01:50         7           L

[34199 rows x 2 columns]
66print(tdrX.get_phases_params("wet_dry")["dry_thr"])
70
67print(tdrX.get_phases_params("wet_dry")["wet_thr"])
3610
68print(tdrX.get_dives_details("row_ids"))
                     dive_id  postdive_id dive_phase
date_time
2002-01-05 11:32:00        0            0          X
2002-01-05 11:32:05        0            0          X
2002-01-05 11:32:10        0            0          X
2002-01-05 11:32:15        0            0          X
2002-01-05 11:32:20        0            0          X
...                      ...          ...        ...
2002-01-07 11:01:30        0          426          X
2002-01-07 11:01:35        0          426          X
2002-01-07 11:01:40        0          426          X
2002-01-07 11:01:45        0          426          X
2002-01-07 11:01:50        0          426          X

[34199 rows x 3 columns]
69print(tdrX.get_dives_details("spline_derivs"))
                                   y
1   0 days 00:00:00            1.449
    0 days 00:00:01.363636364  1.386
    0 days 00:00:02.727272727  1.223
    0 days 00:00:04.090909091  0.953
    0 days 00:00:05.454545455  0.594
...                              ...
426 0 days 00:02:38.465346535 -0.935
    0 days 00:02:40.099009901 -0.967
    0 days 00:02:41.732673267 -0.992
    0 days 00:02:43.366336634 -1.011
    0 days 00:02:45              NaN

[10920 rows x 1 columns]
70print(tdrX.get_dives_details("crit_vals"))
         descent_crit  ascent_crit  descent_crit_rate  ascent_crit_rate
dive_id
1                   1          2.0          1.989e-01        -1.989e-01
2                  11         12.0          5.317e-02        -2.508e-03
3                  15         21.0          7.406e-04        -1.047e-01
4                  16         17.0          4.277e-03        -2.780e-02
5                   3          4.0          1.012e-01        -2.485e-02
...               ...          ...                ...               ...
422                10         17.0          1.857e-03        -5.450e-04
423                 9         16.0          8.120e-03        -1.982e-01
424                 8         13.0          2.544e-01        -1.630e-01
425                11         15.0          3.591e-03        -7.462e-02
426                14         15.0          4.773e-02        -7.283e-02

[426 rows x 4 columns]
Time budgets#
71print(tdrX.time_budget(ignore_z=True, ignore_du=False))
                         beg phase_label                 end
phase_id
1        2002-01-05 11:32:00           L 2002-01-05 11:39:40
2        2002-01-05 11:39:45           W 2002-01-05 11:42:05
3        2002-01-05 11:42:10           U 2002-01-05 11:42:10
4        2002-01-05 11:42:15           W 2002-01-05 11:46:10
5        2002-01-05 11:46:15           U 2002-01-05 11:46:15
...                      ...         ...                 ...
2928     2002-01-07 09:06:25           U 2002-01-07 09:06:25
2929     2002-01-07 09:06:30           W 2002-01-07 09:06:55
2930     2002-01-07 09:07:00           U 2002-01-07 09:07:00
2931     2002-01-07 09:07:05           W 2002-01-07 11:00:05
2932     2002-01-07 11:00:10           L 2002-01-07 11:01:50

[2932 rows x 3 columns]
72print(tdrX.time_budget(ignore_z=True, ignore_du=True))
                         beg phase_label                 end
phase_id
1        2002-01-05 11:32:00           L 2002-01-05 11:39:40
2        2002-01-05 11:39:45           W 2002-01-06 06:30:00
3        2002-01-06 06:30:05           L 2002-01-06 17:01:10
4        2002-01-06 17:01:15           W 2002-01-07 05:00:30
5        2002-01-07 05:00:35           L 2002-01-07 07:34:00
6        2002-01-07 07:34:05           W 2002-01-07 11:00:05
7        2002-01-07 11:00:10           L 2002-01-07 11:01:50
Dive statistics#
73print(tdrX.dive_stats())
                begdesc             enddesc              begasc  desctim  \
1   2002-01-05 12:20:15 2002-01-05 12:20:15 2002-01-05 12:20:20      2.5
2   2002-01-05 21:19:45 2002-01-05 21:20:35 2002-01-05 21:20:40     52.5
3   2002-01-05 21:22:10 2002-01-05 21:23:20 2002-01-05 21:23:50     72.5
4   2002-01-05 21:26:25 2002-01-05 21:27:40 2002-01-05 21:27:45     77.5
5   2002-01-05 21:30:40 2002-01-05 21:30:50 2002-01-05 21:30:55     12.5
..                  ...                 ...                 ...      ...
422 2002-01-07 03:54:15 2002-01-07 03:55:00 2002-01-07 03:55:35     47.5
423 2002-01-07 03:57:35 2002-01-07 03:58:15 2002-01-07 03:58:50     42.5
424 2002-01-07 04:00:55 2002-01-07 04:01:30 2002-01-07 04:01:55     37.5
425 2002-01-07 04:04:50 2002-01-07 04:05:40 2002-01-07 04:06:00     52.5
426 2002-01-07 04:13:40 2002-01-07 04:14:45 2002-01-07 04:14:50     67.5

     botttim  asctim  divetim  descdist  bottdist  ascdist  ...  ascD_mean  \
1        5.0     2.5     10.0       6.0       0.0      6.0  ...     -1.253
2        5.0    42.5    100.0      29.0       0.0     29.0  ...     -0.630
3       30.0    72.5    175.0      63.0       8.0     67.0  ...     -0.849
4        5.0    82.5    165.0      67.0       1.0     66.0  ...     -0.769
5        5.0     7.5     25.0       7.0       0.0      7.0  ...     -0.716
..       ...     ...      ...       ...       ...      ...  ...        ...
422     35.0    57.5    140.0      54.0      10.0     54.0  ...     -0.851
423     35.0    52.5    130.0      54.0       9.0     59.0  ...     -1.041
424     25.0    77.5    140.0      57.0      20.0     77.0  ...     -0.917
425     20.0    67.5    140.0      77.0      12.0     70.0  ...     -0.989
426      5.0    87.5    160.0      86.0       2.0     84.0  ...     -0.930

     ascD_std  ascD_min  ascD_25%  ascD_50%  ascD_75%  ascD_max  \
1       0.222    -1.449    -1.402    -1.305    -1.156    -0.953
2       0.175    -0.810    -0.740    -0.701    -0.572    -0.152
3       0.153    -1.172    -0.929    -0.807    -0.759    -0.482
4       0.216    -1.055    -0.949    -0.777    -0.654    -0.134
5       0.139    -0.810    -0.807    -0.786    -0.680    -0.438
..        ...       ...       ...       ...       ...       ...
422     0.225    -1.140    -1.008    -0.887    -0.713    -0.213
423     0.387    -1.832    -1.255    -0.936    -0.729    -0.539
424     0.382    -1.822    -0.958    -0.745    -0.713    -0.163
425     0.359    -1.655    -1.224    -0.883    -0.766    -0.153
426     0.319    -1.619    -1.063    -0.827    -0.708    -0.315

       postdive_dur  postdive_tdist  postdive_mean_speed
1   0 days 08:59:15       50785.609                1.575
2   0 days 00:00:40          27.279                0.682
3   0 days 00:01:15          63.263                0.844
4   0 days 00:01:25         161.248                1.897
5   0 days 00:00:25          39.568                1.583
..              ...             ...                  ...
422 0 days 00:00:55          37.836                0.688
423 0 days 00:01:05          32.042                0.534
424 0 days 00:01:30          16.169                0.190
425 0 days 00:06:25        -107.598               -0.291
426 0 days 06:45:30       -4925.427               -0.329

[426 rows x 46 columns]
Dive stamps#
74print(tdrX.stamp_dives())
         phase_id                 beg                 end
dive_id
1               2 2002-01-05 12:20:15 2002-01-06 03:50:40
2               2 2002-01-05 12:20:15 2002-01-06 03:50:40
3               2 2002-01-05 12:20:15 2002-01-06 03:50:40
4               2 2002-01-05 12:20:15 2002-01-06 03:50:40
5               2 2002-01-05 12:20:15 2002-01-06 03:50:40
...           ...                 ...                 ...
422             4 2002-01-06 17:31:35 2002-01-07 04:16:15
423             4 2002-01-06 17:31:35 2002-01-07 04:16:15
424             4 2002-01-06 17:31:35 2002-01-07 04:16:15
425             4 2002-01-06 17:31:35 2002-01-07 04:16:15
426             4 2002-01-06 17:31:35 2002-01-07 04:16:15

[426 rows x 3 columns]
Feel free to download a copy of this demo
(demo_tdr.py).
