Bout analysis#
Here is a brief demo on bout analysis with the bouts module for
data generated by mixtures of random Poisson processes.
Set up the environment. Consider loading the logging module and
setting up a logger to monitor progress to this section.
 1# Set up
 2import importlib.resources as rsrc
 3import pandas as pd
 4import matplotlib.pyplot as plt
 5from skdiveMove import calibrate
 6import skdiveMove.bouts as skbouts
 7
 8# Declare figure sizes
 9_FIG1X1 = (7, 6)
10_FIG1X2 = (12, 5)
11_FIG3X1 = (11, 11)
Calculate postdive duration#
Create a TDR object to easily calculate the necessary
statistics:
17config_file = (rsrc.files("skdiveMove") / "config_examples" /
18               "ag_mk7_2002_022_config.json")
19tdr_file = (rsrc.files("skdiveMove") / "tests" /
20            "data" / "ag_mk7_2002_022.nc")
21tdrX = calibrate(tdr_file, config_file)
22stats = tdrX.dive_stats()
23stamps = tdrX.stamp_dives(ignore_z=True)
24stats_tab = pd.concat((stamps, stats), axis=1)
25stats_tab.info()
<class 'pandas.core.frame.DataFrame'>
Index: 426 entries, 1 to 426
Data columns (total 49 columns):
 #   Column               Non-Null Count  Dtype
---  ------               --------------  -----
 0   phase_id             426 non-null    int64
 1   beg                  426 non-null    datetime64[ns]
 2   end                  426 non-null    datetime64[ns]
 3   begdesc              426 non-null    datetime64[ns]
 4   enddesc              426 non-null    datetime64[ns]
 5   begasc               426 non-null    datetime64[ns]
 6   desctim              426 non-null    float64
 7   botttim              292 non-null    float64
 8   asctim               426 non-null    float64
 9   divetim              426 non-null    float64
 10  descdist             426 non-null    float64
 11  bottdist             292 non-null    float64
 12  ascdist              426 non-null    float64
 13  bottdep_mean         292 non-null    float64
 14  bottdep_median       292 non-null    float64
 15  bottdep_sd           292 non-null    float64
 16  maxdep               426 non-null    float64
 17  desc_tdist           202 non-null    float64
 18  desc_mean_speed      202 non-null    float64
 19  desc_angle           171 non-null    float64
 20  bott_tdist           292 non-null    float64
 21  bott_mean_speed      292 non-null    float64
 22  asc_tdist            160 non-null    float64
 23  asc_mean_speed       160 non-null    float64
 24  asc_angle            154 non-null    float64
 25  descD_mean           426 non-null    float64
 26  descD_std            426 non-null    float64
 27  descD_min            426 non-null    float64
 28  descD_25%            426 non-null    float64
 29  descD_50%            426 non-null    float64
 30  descD_75%            426 non-null    float64
 31  descD_max            426 non-null    float64
 32  bottD_mean           292 non-null    float64
 33  bottD_std            292 non-null    float64
 34  bottD_min            292 non-null    float64
 35  bottD_25%            292 non-null    float64
 36  bottD_50%            292 non-null    float64
 37  bottD_75%            292 non-null    float64
 38  bottD_max            292 non-null    float64
 39  ascD_mean            426 non-null    float64
 40  ascD_std             425 non-null    float64
 41  ascD_min             426 non-null    float64
 42  ascD_25%             426 non-null    float64
 43  ascD_50%             426 non-null    float64
 44  ascD_75%             426 non-null    float64
 45  ascD_max             426 non-null    float64
 46  postdive_dur         426 non-null    timedelta64[ns]
 47  postdive_tdist       420 non-null    float64
 48  postdive_mean_speed  420 non-null    float64
dtypes: datetime64[ns](5), float64(42), int64(1), timedelta64[ns](1)
memory usage: 166.4 KB
Extract postdive duration for further analysis.
26postdives = stats_tab["postdive_dur"][stats_tab["phase_id"] == 4]
27postdives_diff = (postdives.dt.total_seconds()
28                  .diff().iloc[1:].abs())
29# Remove isolated dives
30postdives_diff = postdives_diff[postdives_diff < 2000]
Non-linear least squares via “broken-stick” model#
skdiveMove provides the bouts.BoutsNLS class for fitting
non-linear least squares (NLS) models to a modified histogram of a given
variable.
The first step is to generate a modified histogram of postdive duration, and this requires choosing the bin width for the histogram.
31postdives_nlsbouts = skbouts.BoutsNLS(postdives_diff, 0.1)
32print(postdives_nlsbouts)
Class BoutsNLS object
histogram method:    standard
log-frequency histogram:
              x  lnfreq
count    46.000  46.000
mean    307.983  -4.079
std     383.530   2.119
min       0.050  -8.216
25%      62.550  -5.521
50%     132.550  -3.912
75%     351.300  -3.219
max    1449.950   3.091
Two-process model#
Assuming a 2-process model, calculate starting values, providing a guess at 50 s interdive interval.
33fig, ax = plt.subplots(figsize=_FIG1X1)
34init_pars2 = postdives_nlsbouts.init_pars([50], plot=True, ax=ax)
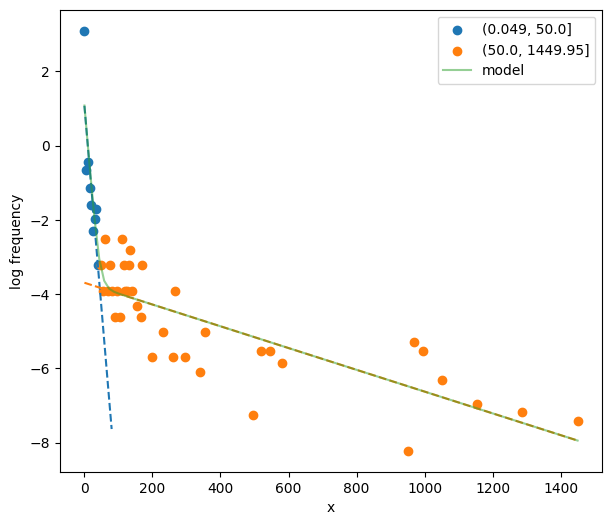
Fit the two-process model.
35coefs2, pcov2 = postdives_nlsbouts.fit(init_pars2)
36# Coefficients
37print(coefs2)
        (0.049, 50.0]  (50.0, 1449.95]
a              25.756            8.307
lambda          0.119            0.003
38# Covariance between parameters
39print(pcov2)
[[+1.180e+02 +1.713e-01 +3.055e-01 +6.586e-05]
 [+1.713e-01 +8.032e-04 +6.607e-03 +1.584e-06]
 [+3.055e-01 +6.607e-03 +1.690e+00 +6.461e-05]
 [+6.586e-05 +1.584e-06 +6.461e-05 +1.542e-07]]
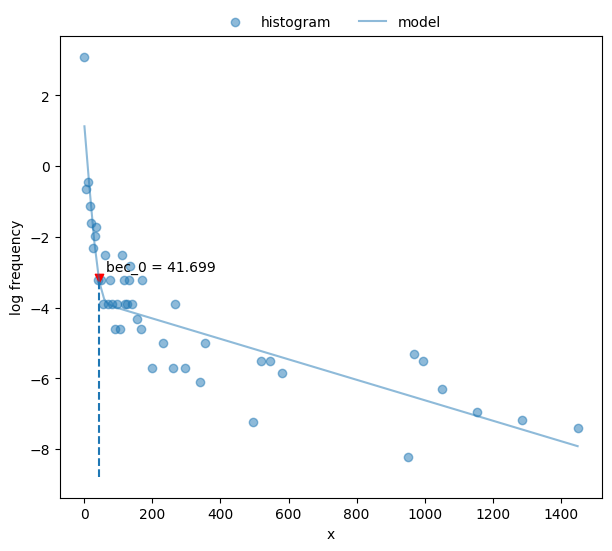
Calculate bout-ending criterion.
40# `bec` returns ndarray, and we have only one here
41print("bec = {[0]:.2f}".format(postdives_nlsbouts.bec(coefs2)))
bec = 41.70
Plot the fit.
42fig, ax = plt.subplots(figsize=_FIG1X1)
43postdives_nlsbouts.plot_fit(coefs2, ax=ax);
Three-process model#
Attempt to discern three processes in the data.
44fig, ax = plt.subplots(figsize=_FIG1X1)
45init_pars3 = postdives_nlsbouts.init_pars([50, 550], plot=True, ax=ax)
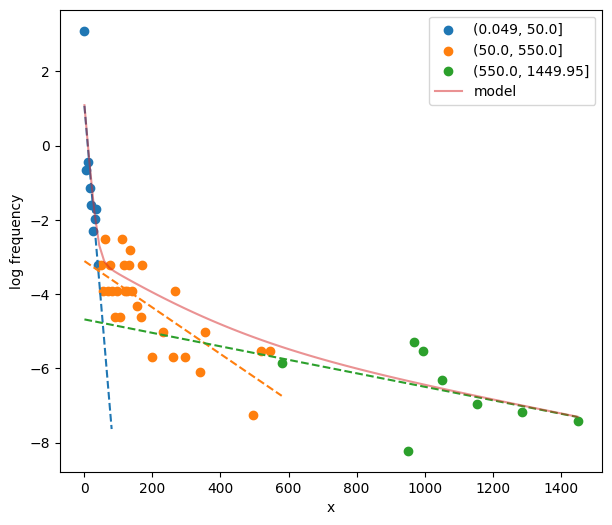
Fit three-process model.
46coefs3, pcov3 = postdives_nlsbouts.fit(init_pars3)
47# Coefficients
48print(coefs3)
        (0.049, 50.0]  (50.0, 550.0]  (550.0, 1449.95]
a              29.812          7.094             3.913
lambda          0.254          0.014             0.001
49# Covariance between parameters
50print(pcov3)
[[+2.241e+02 +4.746e-01 -4.352e-01 -1.852e-03 -1.422e-01 -1.187e-04]
 [+4.746e-01 +6.365e-03 +3.179e-02 +9.877e-05 +6.796e-03 +5.591e-06]
 [-4.352e-01 +3.179e-02 +2.749e+00 +1.380e-03 -2.567e-01 -3.133e-04]
 [-1.852e-03 +9.877e-05 +1.380e-03 +2.145e-05 +2.135e-03 +1.889e-06]
 [-1.422e-01 +6.796e-03 -2.567e-01 +2.135e-03 +9.747e-01 +2.138e-04]
 [-1.187e-04 +5.591e-06 -3.133e-04 +1.889e-06 +2.138e-04 +5.340e-07]]
Plot the fit.
51fig, ax = plt.subplots(figsize=_FIG1X1)
52postdives_nlsbouts.plot_fit(coefs3, ax=ax);
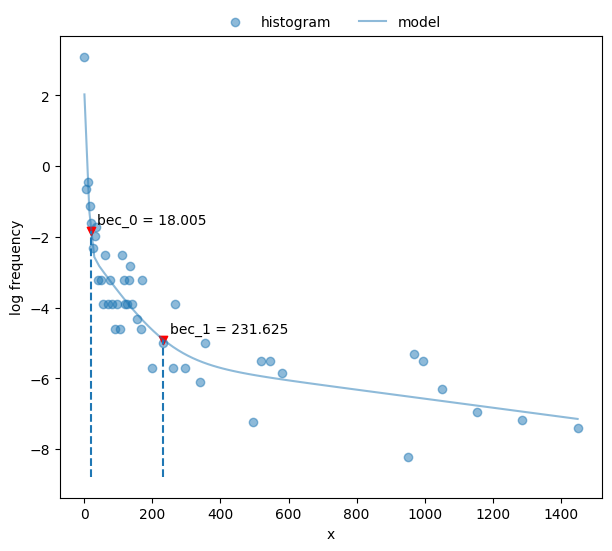
Compare the cumulative frequency distributions of two- vs three-process models.
53fig, axs = plt.subplots(1, 2, figsize=_FIG1X2)
54postdives_nlsbouts.plot_ecdf(coefs2, ax=axs[0])
55postdives_nlsbouts.plot_ecdf(coefs3, ax=axs[1]);
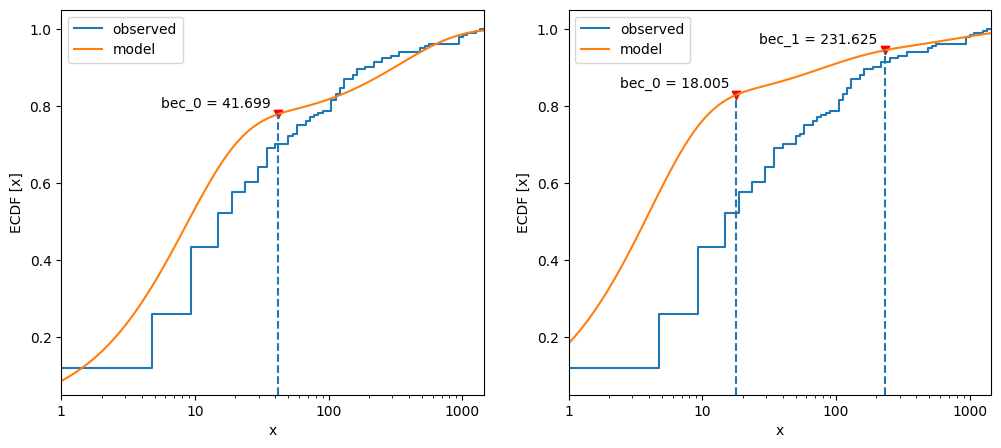
The three-process model does not follow the observed data as well as the two-process model.
Maximum likelihood estimation#
Another way to model Poisson mixtures that does not rely on the
subjectively created histogram, and involves fewer parameters, requires
fitting via maximum likelihood estimation (MLE). This approach is available
in bouts.BoutsMLE.
Set up an instance.
56postdives_mlebouts = skbouts.BoutsMLE(postdives_diff, 0.1)
57print(postdives_mlebouts)
Class BoutsMLE object
histogram method:    standard
log-frequency histogram:
              x  lnfreq
count    46.000  46.000
mean    307.983  -4.079
std     383.530   2.119
min       0.050  -8.216
25%      62.550  -5.521
50%     132.550  -3.912
75%     351.300  -3.219
max    1449.950   3.091
Again, assuming a 2-process model, calculate starting values.
58fig, ax = plt.subplots(figsize=_FIG1X1)
59init_pars = postdives_mlebouts.init_pars([50], plot=True, ax=ax)
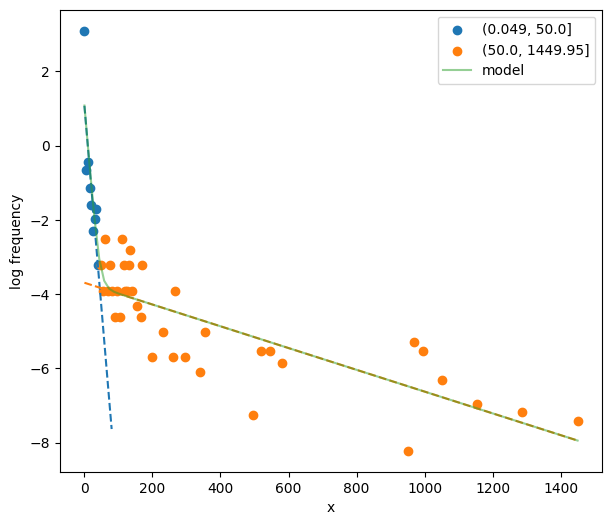
Fit the two-process model. It is important, but optional, to supply reasonable bounds to help the optimization algorithm. Otherwise, the algorithm may fail to converge. The fitting procedure is done in two steps: with and without a reparameterized log-likelihood function. Therefore, there are two sets of bounds required.
60p_bnd = (-2, None)                 # bounds for `p`
61lda1_bnd = (-5, None)              # bounds for `lambda1`
62lda2_bnd = (-10, None)             # bounds for `lambda2`
63bnd1 = (p_bnd, lda1_bnd, lda2_bnd)
64p_bnd = (1e-2, None)
65lda1_bnd = (1e-4, None)
66lda2_bnd = (1e-8, None)
67bnd2 = (p_bnd, lda1_bnd, lda2_bnd)
68fit1, fit2 = postdives_mlebouts.fit(init_pars,
69                                    fit1_opts=dict(method="L-BFGS-B",
70                                                   bounds=bnd1),
71                                    fit2_opts=dict(method="L-BFGS-B",
72                                                   bounds=bnd2))
73# First fit
74print(fit1)
  message: CONVERGENCE: REL_REDUCTION_OF_F_<=_FACTR*EPSMCH
  success: True
   status: 0
      fun: 917.8524699061169
        x: [ 8.264e-01 -2.690e+00 -5.629e+00]
      nit: 7
      jac: [-1.478e-04 -1.705e-04  0.000e+00]
     nfev: 36
     njev: 9
 hess_inv: <3x3 LbfgsInvHessProduct with dtype=float64>
75# Second fit
76print(fit2)
  message: CONVERGENCE: REL_REDUCTION_OF_F_<=_FACTR*EPSMCH
  success: True
   status: 0
      fun: 917.8524699061167
        x: [ 6.956e-01  6.791e-02  3.592e-03]
      nit: 1
      jac: [-7.049e-04 -2.342e-03  1.579e-02]
     nfev: 28
     njev: 7
 hess_inv: <3x3 LbfgsInvHessProduct with dtype=float64>
Calculate bout-ending criterion (BEC).
77print("bec = {:.2f}".format(postdives_mlebouts.bec(fit2)))
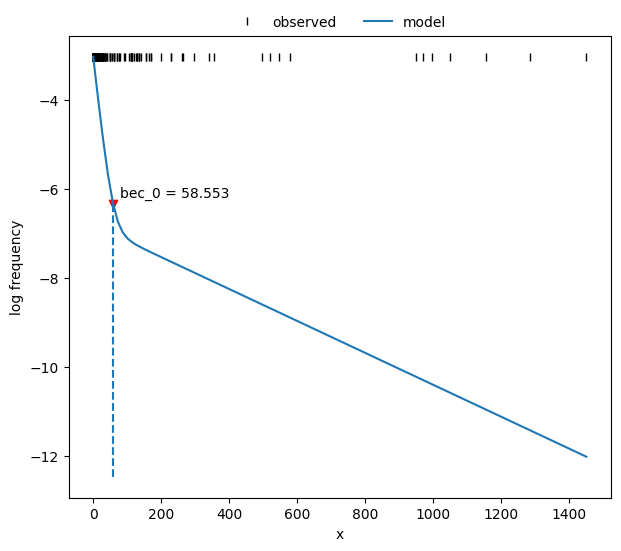
bec = 58.55
Plot the fit.
78fig, ax = plt.subplots(figsize=_FIG1X1)
79postdives_mlebouts.plot_fit(fit2, ax=ax);
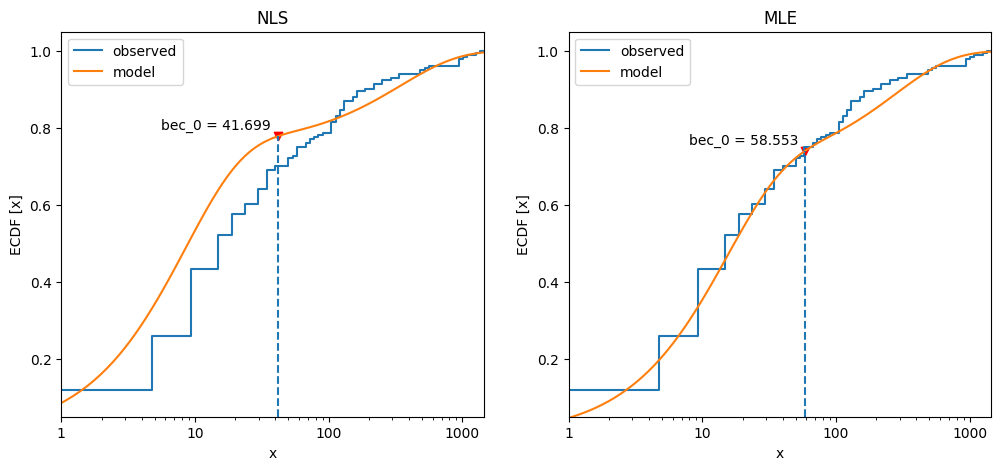
Compare the cumulative frequency distribution between NLS and MLE model estimates.
80fig, axs = plt.subplots(1, 2, figsize=_FIG1X2)
81postdives_nlsbouts.plot_ecdf(coefs2, ax=axs[0])
82axs[0].set_title("NLS")
83postdives_mlebouts.plot_ecdf(fit2, ax=axs[1])
84axs[1].set_title("MLE");
Label bouts based on BEC from the last MLE model. Note that Timedelta type needs to be converted to total seconds to allow comparison with BEC.
85bec = postdives_mlebouts.bec(fit2)
86skbouts.label_bouts(postdives.dt.total_seconds(), bec, as_diff=True)
236     1
237     2
238     3
239     4
240     4
       ..
422    51
423    51
424    51
425    52
426    52
Name: postdive_dur, Length: 191, dtype: int64
Feel free to download a copy of this demo
(demo_bouts.py).
